Use interactivity to enable data exploration, understanding and communication
Design web apps with displays that fit for the purpose
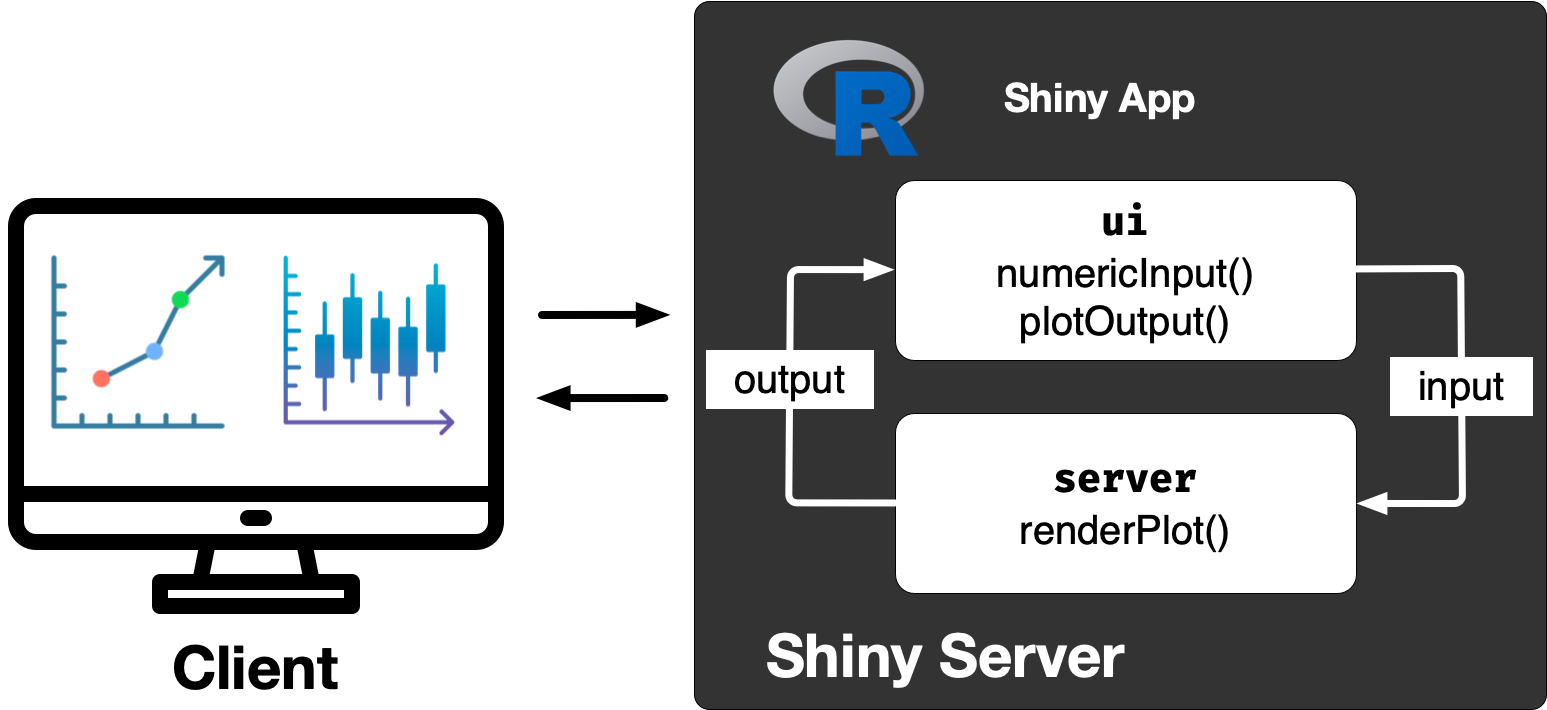
Make web applications using shiny
Why
Interactive web apps can
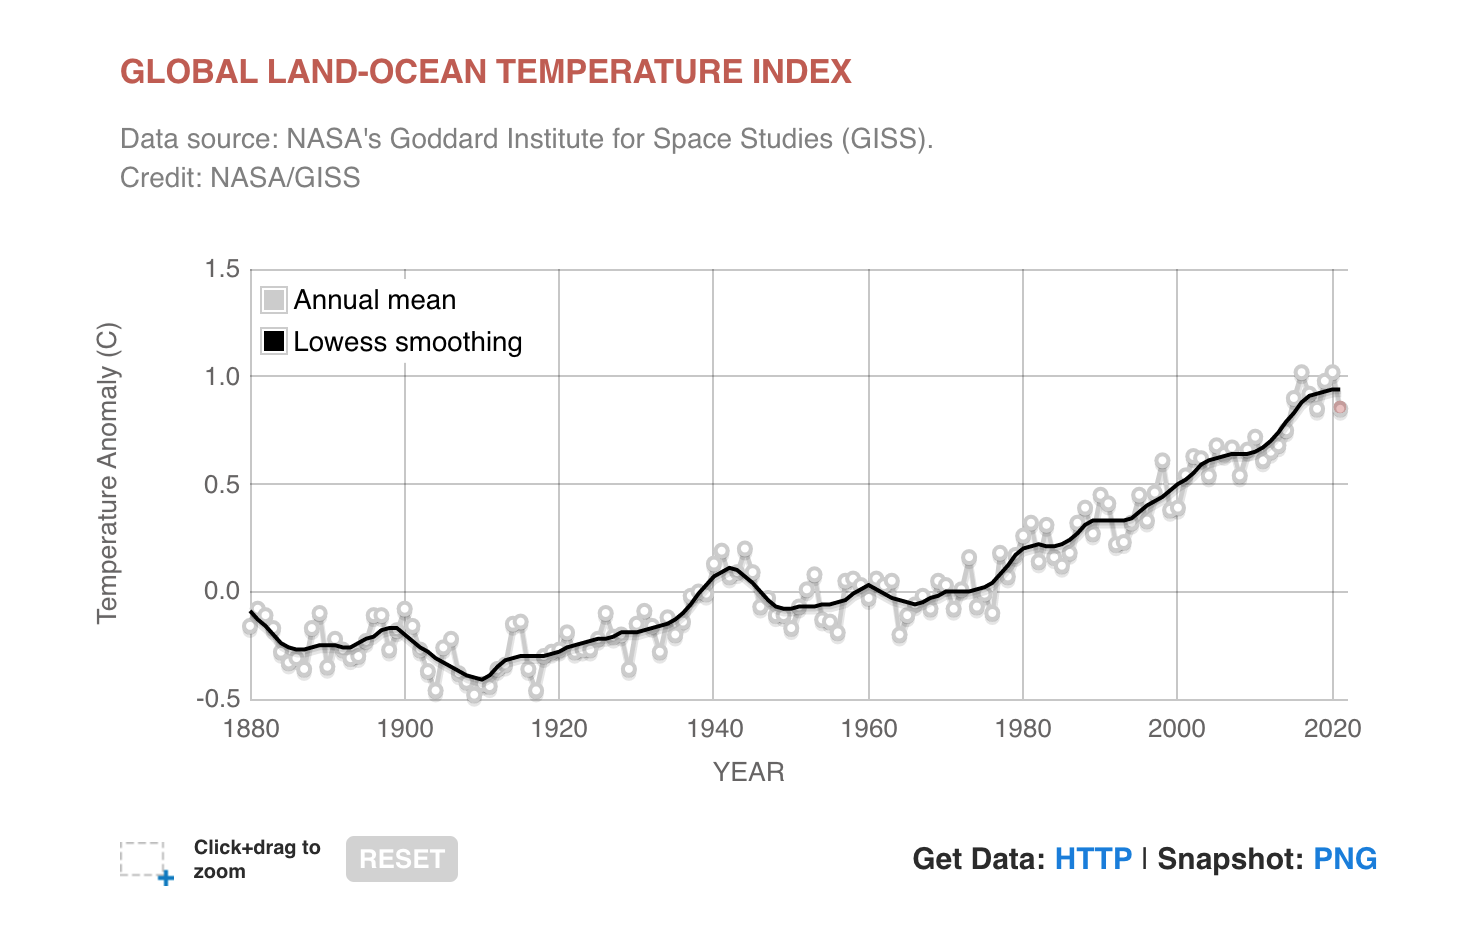
connect people and data,
make systems playful,
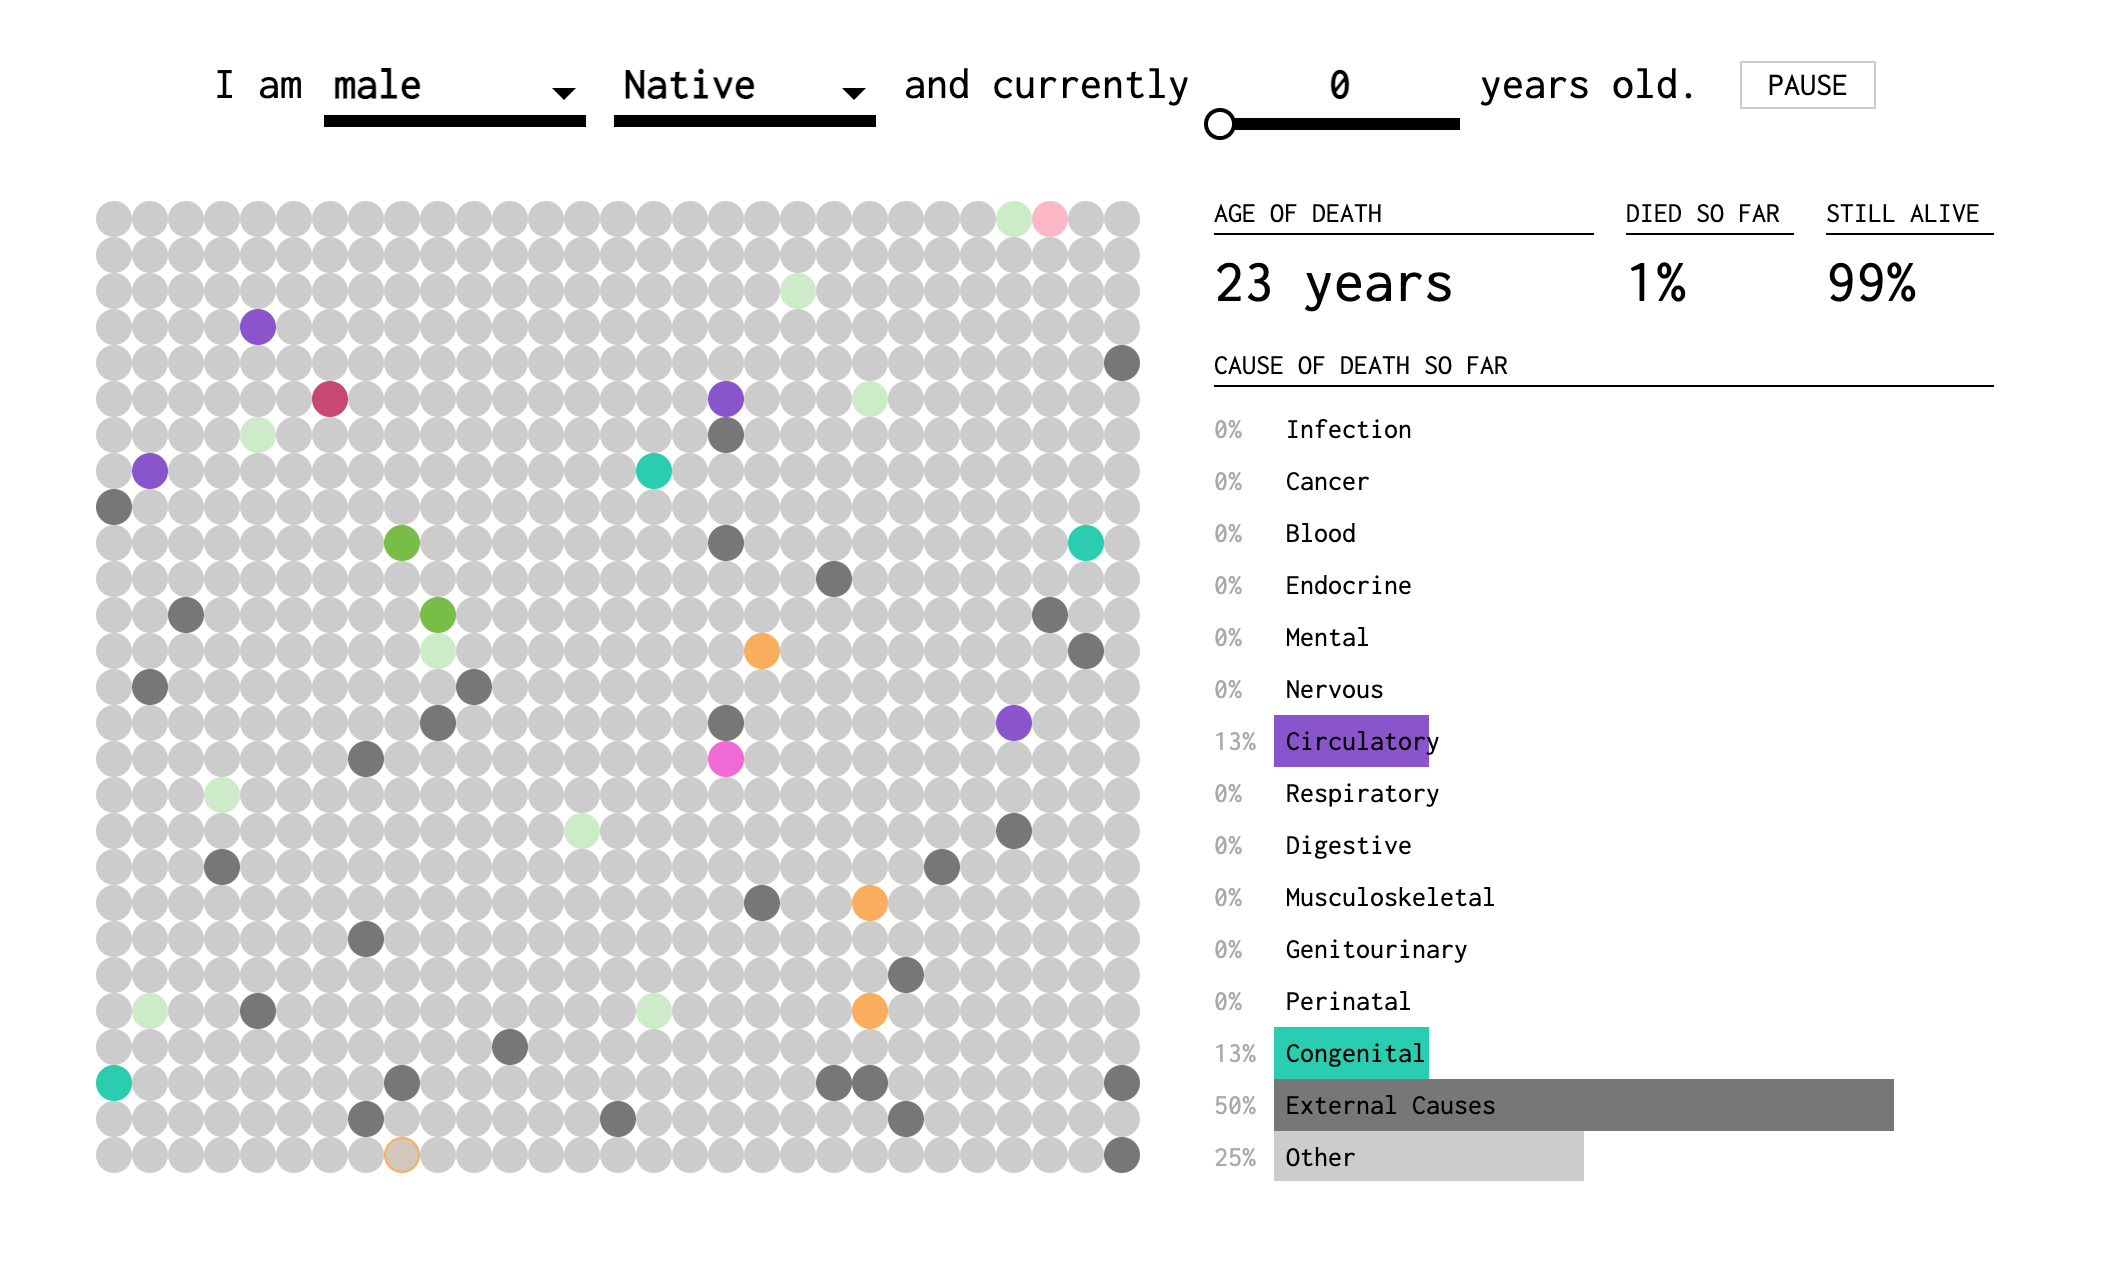
prompt self-reflection,
personalise the view, and
reduce cognitive load.
Human Computer Interaction
Open-ended dialogue between the user and the computer
Enable audience to some degree co-author narrative, i.e. narratives moves away from being author-guided to audience-driven.
Leverage user interaction techniques to improve user experience, e.g.
Show details on demand
Reduce overall cognitive load
Personalised view
User Interactions
Image from Spencer (2022, Feb. 17). Data in Wonderland. Retrieved from https://ssp3nc3r.github.io/data_in_wonderland
User Inputs
Image from Spencer (2022, Feb. 17). Data in Wonderland. Retrieved from https://ssp3nc3r.github.io/data_in_wonderland
Criteria for the Design of Interactive Data Visualisation
Tominski, Christian, and Heidrun Schumann (2020) Interactive Visual Data Analysis. CRC Press.
Quality criteria
Expressiveness (Mandatory Condition)
An interactive visual representation is expressive if it allows the user to carry out the actions needed to acquire the desired information in the data.
Effectiveness (Goal-Oriented Condition)
A measure of how well the user can convey an interaction intent to the computer.
Efficiency (Desired Condition)
The balance of benefits and costs for using an interactive visualisation approach. E.g. does the human effort of building the interactive visualisation outweigh its benefits? Are the efforts of users to interact with it offset the information gained for users?
Goals
Exploration promotes undirected search
Description characterises observations by associated data elements
Explanation identifies contributing causes behind an observation
Confirmation find concrete evidences for or against a hypothesis
Presentation communicates results of a confirmed analysis
library(shiny)tags$html( tags$body(h1('My first heading'),p('My first paragraph, with some ', strong('bold'), ' text.'),div(id ='myDiv', class ='simpleDiv','Here is a div with some attributes.') ))
My first heading
My first paragraph, with some
bold
text.
Here is a div with some attributes.
Writing HTML from R
<html>
  <body>
    <h1>My first heading</h1>
    <p>
      My first paragraph, with some
      <strong>bold</strong>
       text.
    </p>
    <div id="myDiv" class="simpleDiv">Here is a div with some attributes.</div>
  </body>
</html>
Use includeCSS() and includeScript() to include CSS and JS files
Note the function-style calling of the reactive expression. This is easy to forget!
The req function
When you have inputs that are required for an output to be generated, you can use the req function to stop execution of the code until the required inputs are available.
This is useful when you have inputs that are optional, e.g. a date range input that may be empty.
output$myplot <-renderPlot({req(input$date_range) # Stop here if date_range is NULLplot(cars)})
fluidPage(fluidRow(column(width =4,h3("Some informative table"),tableOutput("mytable")),column(width =4, offset =3,h3("Fancy plot"),plotOutput("myplot"))),fluidRow(column(width =12, "Minimum width is 1 and maximum width is 12")))
<div class="container-fluid">
  <div class="row">
    <div class="col-sm-4">
      <h3>Some informative table</h3>
      <div id="mytable" class="shiny-html-output"></div>
    </div>
    <div class="col-sm-4 offset-md-3 col-sm-offset-3">
      <h3>Fancy plot</h3>
      <div id="myplot" class="shiny-plot-output" style="width:100%;height:400px;"></div>
    </div>
  </div>
  <div class="row">
    <div class="col-sm-12">Minimum width is 1 and maximum width is 12</div>
  </div>
</div>