ETC5523: Communicating with Data
Basic communication theory and practice
Lecturer: Michael Lydeamore
Department of Econometrics and Business Statistics
👩🏻🏫 ETC5523 Teaching Team

Dr. Michael Lydeamore
Lecturer & Chief Examiner
Maliny Po
TutorContacting the teaching team
- For private matters, contact michael.lydeamore@monash.edu using your Monash student email and citing the unit name.
- For non-private matters, you should post this on the Ed discussion board.
👩🏻🏫 ETC5523 Teaching Team
Most material in this course was developed by
Emi is a guru of data communication, and I highly recommend checking out her website content and academic work.
🎯 ETC5523 Learning Objectives
Learning objectives
- Effectively communicate data analysis, using a blog, reports and presentation.
- Learn how to build a web app to provide an interactive data analysis.
- Learn to construct a data story.
Specific outcomes
After this unit, you should be able to:
- understand and apply the elements of effective communication,
- host Quarto HTML outputs online for blogging, reports or other purposes,
- be more confident with web technologies (HTML/CSS),
- make a Shiny web app
🏛️ ETC5523 unit structure
- 2 hour lectures are interactive sessions
- 1 hour workshops → practice skills, ask questions in small groups
- 1 hour tutorial → only go to the one you are assigned to!
🪵 Materials
Unit website
- Lecture slides and tutorial materials are available on the unit website
- Lecture videos and assessments will be available on Moodle
Note
Materials are designed to develop your hard and soft skills.
✋ Consultation hours
A total of 2 hours of consultation each week
See Moodle announcement for the Zoom links for the consultations
Seek help early and often!
💯 Course assessments
- Week 4: Assessment 1 (25%) Breaking down key communication concepts in articles
- Week 7: Assessment 2 (25%) Writing your first communication piece
- Week 10: Assessment 3 (20%) Creating your own blog, styling and adding content
- Week 14: Assessment 4 (25%) Turning your findings into a dashbaord
- Oral Presentations: (5%) Starting in Week 2, each week several presentations in the workshop
Course assessments - Oral Presentations
Everyone will give a 5 minute presentation in the workshop, starting in Week 2.
Please sign up to a presentation topic here:

🏁 Expectations Part 1
- Attend lectures, workshops and assigned tutorials
- Minimum total expected workload is 144 hours, that’s 12 hours each week or 8.5 hours of self study per week
- Check the unit homepage and unit Moodle page
- ETC5513 (or equivalent) is a prerequisite → you need to catch up fast if you’re not confident
- Install the latest R and RStudio IDE (or your chosen IDE that has the ability to run R code)
🏁 Expectations Part 2
Be an active learner!
An active learner asks questions, considers alternatives, questions assumptions, and even questions the trustworthiness of the author or speaker. An active learner tries to generalize specific examples, and devise specific examples for generalities.
An active learner doesn’t passively sponge up information — that doesn’t work! — but uses the readings and lecturer’s argument as a springboard for critical thought and deep understanding.
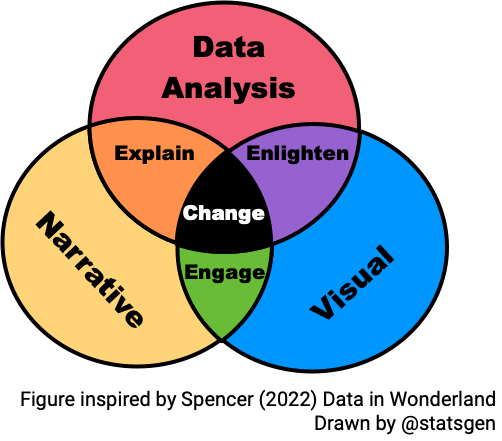
– Spencer (2022) Data in Wonderland
Communication time
Aim
- Basic communication theory and its relevancy with communicating with data
- Demonstrate communication competency by selecting appropriate behaviour based on audience and self monitoring
- Identify and apply rhetorical elements to improve data storytelling
- Clearly articulate and express technical problems for others to help you
Why
- Effective communication with data is a blend of hard and soft skills
- You need the hard skills to process and understand the data
- But you also need the soft skills to get the message across to others
Communicating
To effectively communicate, we must realize that we are all different in the way we perceive the world and use this understanding as a guide to our communication with others.
– Anthony Robbins
Communication is a skill
If you practice, it will get better.
Why should you listen to me though?
I’ve had a lot of practice.
To scientists:
- Dozens of presentations at conferences and seminars,
- Broad collaborations in a wide range of fields
To less technical audiences:
- Hundreds of media interviews,
- Probably a hundred ministerial briefings,
- Many more high level meetings with government and industry stakeholders
Why should you listen to me though?
Communication has got me a lot of where I am now.
A good economist isn’t right all the time, but they are very good at explaining when they are wrong
If you can do technical work and tell people about it, you will be in high demand
Communicating with data
The two words ‘information’ and ‘communication’ are often used interchangeably, but they signify quite different things. Information is giving out; communication is getting through.
– Sydney J. Harris
The Basics of
Communication Theory
Communication here refers to human communication
In this section, communication refers to human communication.
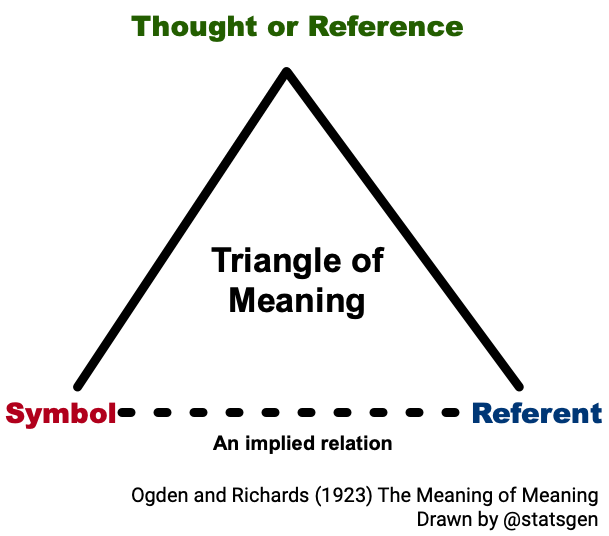
Communication is symbolic
- Arbitrary nature of symbols is overcome with linguistic rules
- Agreement among people about these rules is required to effectively communicate
- Meanings rest in people, not words
Communication is a process
Communication is often thought of as discrete, independent acts but in fact it is a continuous, ongoing process.
Linear communication model
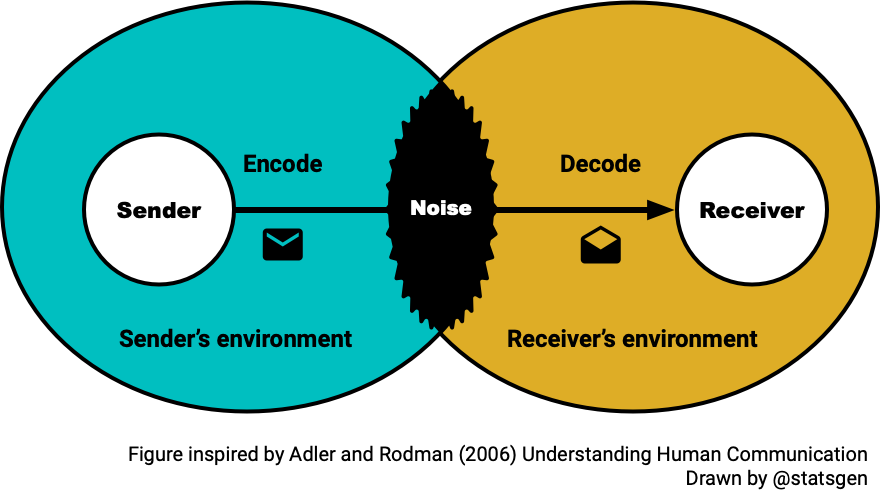
Transactional communication
![]()
Communication competence
- There is no single, ideal way to communicate
- Competence is situational and relational (where, what and who)
- Ability to select the most appropriate behaviour in a particular situation
- Skill to perform behaviour not just knowing them
- Empathy or perspective taking
- Cognitive complexity – ability to construct a variety of framework for viewing an issue
- Self-monitoring – paying close to your own behaviour and use this to shape your behaviour
Types of communication
- Intrapersonal – communicating with one-self
- Dyadic/interpersonal – two people interacting
- Small group – two or more people interacting with group membership
- Public – a group too large for all to contribute
- Mass – messages transmitted to large, wide-spread audiences via media
Tutorial
How does your communication strategy change for different types of communication?
Effective communication
- Communication doesn’t always require complete understanding
- We notice some messages more and ignore others, e.g. we tend to notice messages that are:
- intense,
- repetitious, and
- constrastive.
- Motives also determine what information we select from environment
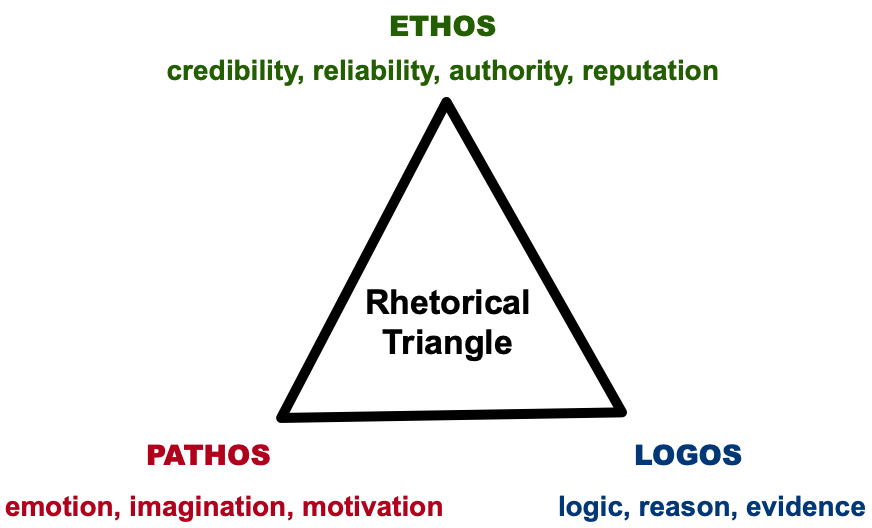
Rhetorics
The art of effective or persuasive speaking or writing
Rhetorical Triangle
No one ever made a decision because of a number. They need a story.
– Daniel Kahneman
Maybe stories are just data with a soul.
– Brene Brown
Hans Rosling
With good communication…
Communicating your problem
Asking for help, requires you to communicate what your problem is to another party.
How you communicate your problem, can assist you greatly in getting the answer to your problem.
🆘 Asking for help 1 Part 1
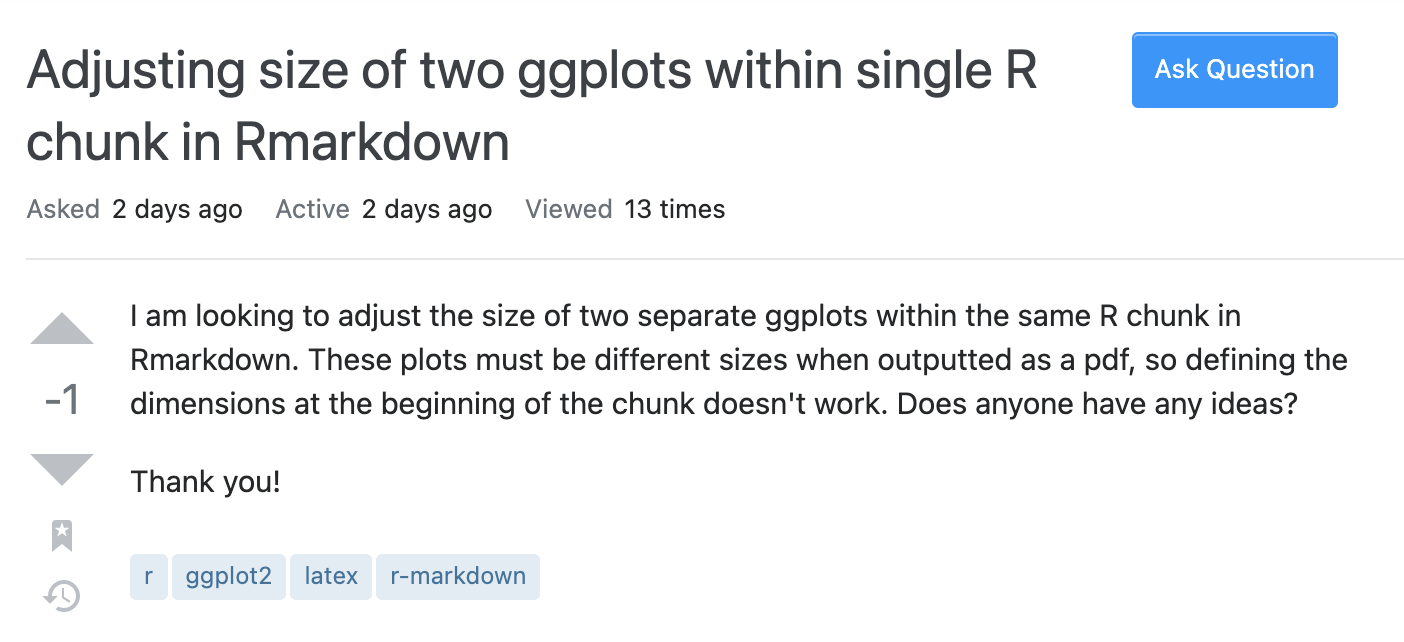
Exercise: Come up with a solution to this problem.
🆘 Asking for help 1 Part 2
I am looking to adjust the size of two separate ggplots within the same R chunk in Rmarkdown. These plots must be different when outputted as a pdf, so defining the dimensions at the beginning of the chunk doesn't work. Does anyone have any ideas? My code is below.🆘 Asking for help 1 Part 3
I am looking to adjust the size of two separate ggplots within the same R chunk in Rmarkdown. These plots must be different when outputted as a pdf, so defining the dimensions at the beginning of the chunk doesn't work. Does anyone have any ideas? My code is below.🆘 Asking for help 1 Part 4
I am looking to adjust the size of two separate ggplots within the same R chunk in Rmarkdown. These plots must be different when outputted as a pdf, so defining the dimensions at the beginning of the chunk doesn't work. Does anyone have any ideas? My code is below.🆘 Asking for help 1 Part 5
I am looking to adjust the size of two separate ggplots within the same R chunk in Rmarkdown. These plots must be different when outputted as a pdf, so defining the dimensions at the beginning of the chunk doesn't work. Does anyone have any ideas? My code is below.❓ How to ask questions?
Checklist (note: not an exhaustive checklist)
If the question is asked in an public forum or similar:
If the problem is computer system related…
If the problem is based on data …
Session Information
You can easily get the session information in R using sessioninfo::session_info().
Scroll to see the packages used to make these slides.
─ Session info ───────────────────────────────────────────────────────────────
 setting  value
 version  R version 4.3.2 (2023-10-31)
 os       Ubuntu 24.04.3 LTS
 system   x86_64, linux-gnu
 ui       X11
 language (EN)
 collate  C.UTF-8
 ctype    C.UTF-8
 tz       UTC
 date     2025-10-20
 pandoc   3.6.3 @ /opt/quarto/bin/tools/ (via rmarkdown)

─ Packages ───────────────────────────────────────────────────────────────────
 ! package     * version date (UTC) lib source
 P cli           3.6.1   2023-03-23 [?] RSPM (R 4.3.0)
 P digest        0.6.33  2023-07-07 [?] RSPM (R 4.3.0)
 P evaluate      0.21    2023-05-05 [?] RSPM (R 4.3.2)
 P fastmap       1.2.0   2024-05-15 [?] RSPM (R 4.3.0)
 P htmltools     0.5.8.1 2024-04-04 [?] RSPM (R 4.3.0)
 P jsonlite      1.8.7   2023-06-29 [?] RSPM (R 4.3.0)
 P knitr         1.45    2023-10-30 [?] RSPM (R 4.3.2)
   renv          1.0.7   2024-04-11 [1] RSPM (R 4.3.0)
 P rlang         1.1.1   2023-04-28 [?] RSPM (R 4.3.0)
 P rmarkdown     2.21    2023-03-26 [?] RSPM (R 4.3.2)
 P sessioninfo   1.2.2   2021-12-06 [?] RSPM (R 4.3.0)
 P xfun          0.52    2025-04-02 [?] RSPM (R 4.3.0)
 P yaml          2.3.7   2023-01-23 [?] RSPM (R 4.3.0)

 [1] /home/runner/work/cwd/cwd/renv/library/R-4.3/x86_64-pc-linux-gnu
 [2] /home/runner/.cache/R/renv/sandbox/R-4.3/x86_64-pc-linux-gnu/95f1b021

 P ── Loaded and on-disk path mismatch.

──────────────────────────────────────────────────────────────────────────────
🎁 Reproducible Example with reprex LIVE DEMO
- Copy your minimum reproducible example then run
- Once you run the above command, your clipboard contains the formatted code and output for you to paste into places like GitHub issues, Stackoverflow and forums powered by Discourse, e.g. RStudio Community.
- For general code questions, I suggest that you post to the community forums rather than Moodle.
Communicating with Data
Week 1 Lesson
Summary
- Communication is a symbolic, ongoing process that requires getting through to other parties
- There is no single ideal way to communicate – communication competence depends on situation and relations but a competent communicator can select and perform appropriate behaviour based on seeing other people’s perspectives and understanding their own behaviour
- We discussed about the elements of rhetorics and how it relates to telling a compelling data story
- We looked at the case study with communicating your problem to ask for help
Week 1 Lesson
Resources
- See more at Learn R Chapter 3: Troubleshooting and asking for help
- Watch more about storytelling with data at: